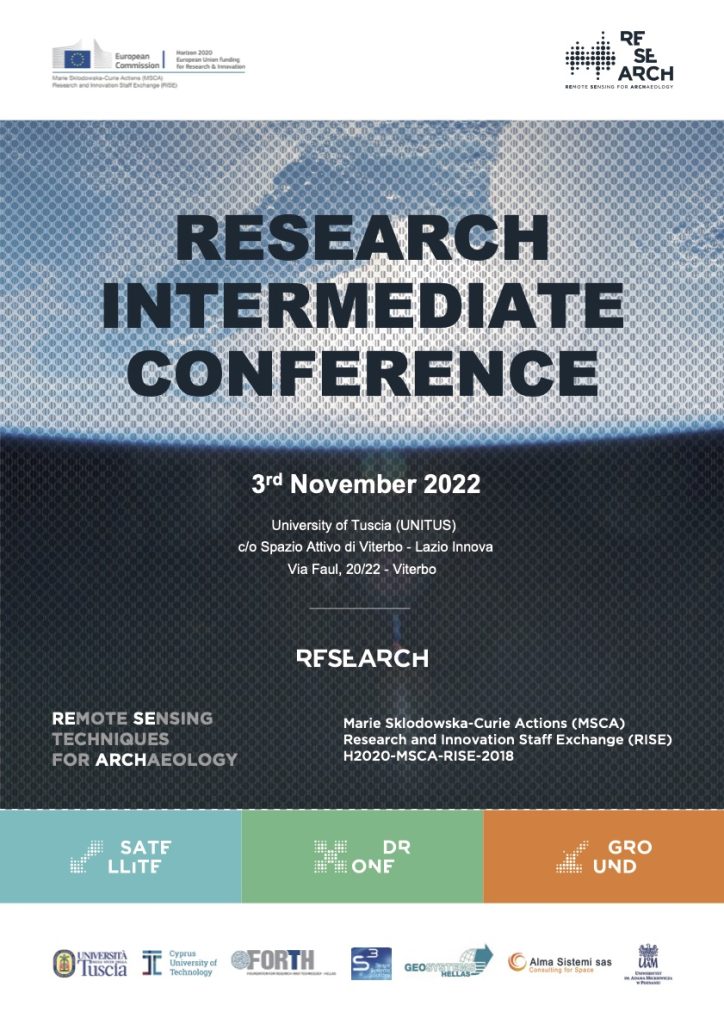
Viterbo, IT, 3rd November 2022 – UNITUS
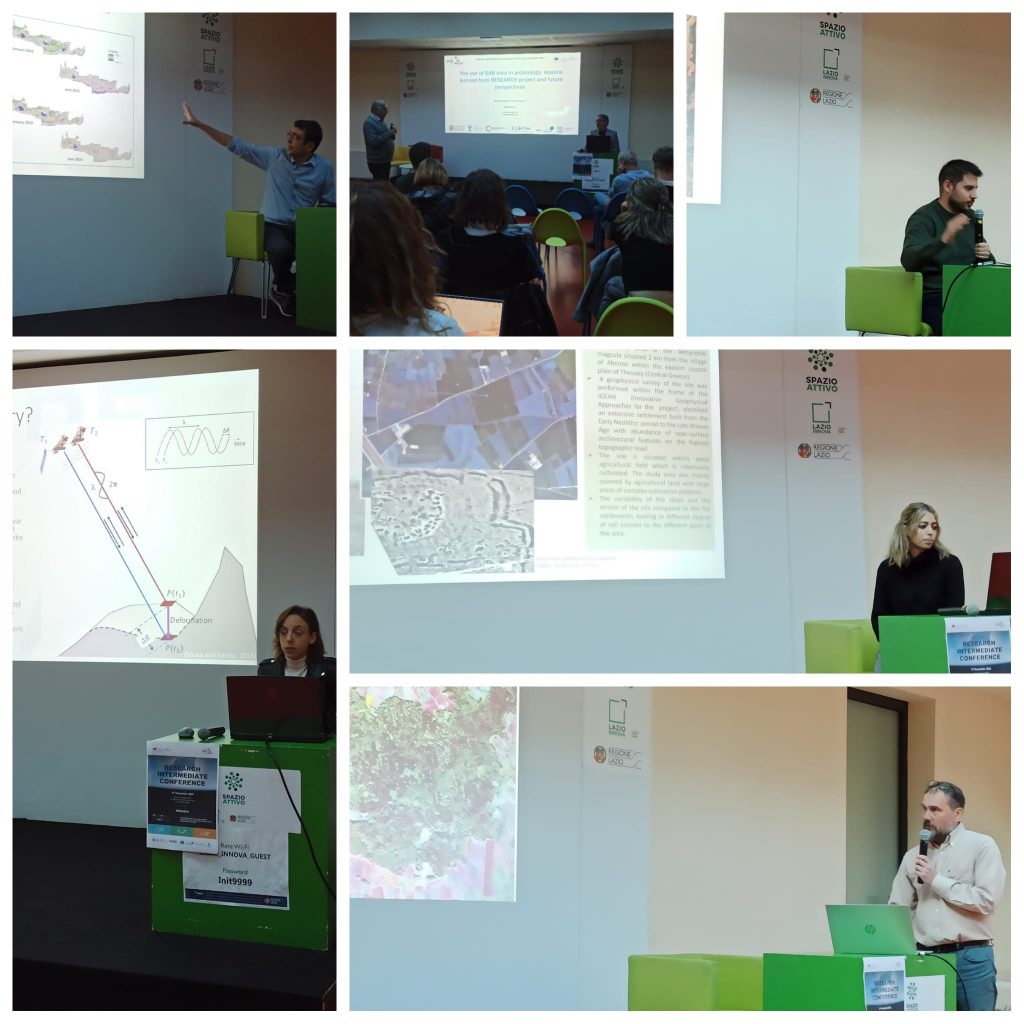
The RESEARCH Project Intermediate Conference was held in Viterbo (Italy) on 3rd November 2022 and was organized by Università degli Studi della Tuscia (UNITUS). The aim of the conference was to showcase the first results of the Project, as well as give input for further research developments.
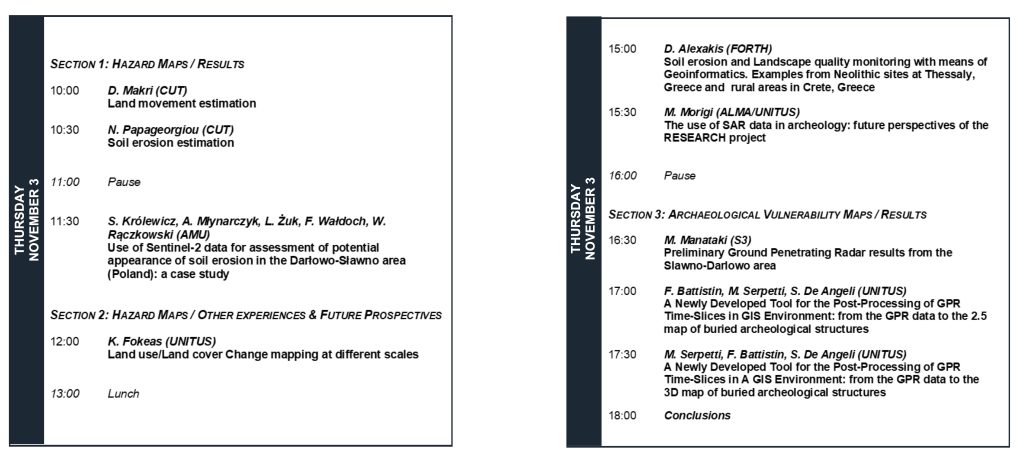
The program included three sections. The first and the second concerned hazard assessments, respectively about project results concerning land movement and soil erosion assessment (WP1, WP2), and other experiences carried out outside the project also to outline future research perspectives. The third section concerned the topic of the vulnerability of cultural heritage and included presentations about methodological and technical advancements done within the Project.
Book of abstract
Section 1: Hazard Maps / Results
Land Movement Estimation
Despoina Makri (CUT)
Land movements are one of the most severe natural disasters which can threaten humanity and public property, such as archaeological sites worldwide. Since 1978, when we had the first Synthetic Aperture Radar (SAR) (Mantovani et al., 2019) data, remote sensing seems to be a useful tool for Earth Observation even for the most challenging issues. SAR technology has been implemented in many cases to detect land subsidence after a seismic activity (Goorabi, 2019) or a landslide (Calò et al., 2014; Del Ventisette et al., 2014; Mantovani et al., 2019). Nowadays, with technological advances, we have plenty of missions (e.g., COSMO-SkyMed, ERS-1/2), and in many cases, this information is freely available for everyone, for example, with the mission of Sentinel-1. This leads to the production of new processing tools, algorithms, and models (Massonnet and Feigl, 1998). For the land movement estimation for Amathus archaeological site in the Limassol district, we will the Interferometric Synthetic Aperture Radar (InSAR) approach. This method uses two SAR images of the same study area with different dates/years and detects the relative displacement on a pixel-by-pixel calculation/comparison. This technique can be very accurate and can detect displacements, even on a scale of millimetres.
Soil Erosion Estimation
Nikoletta Papageorgiou (CUT)
Soil erosion is one of the most prominent natural hazards that affected sustainable cultural heritage site management due to several factors including climate variations and human activities, especially in the Mediterranean area. For a better understanding of the geographical distribution of soil erosion and the interaction of their driving mechanisms, empirical models of soil erosion are required. Thus, the present study, for the first time, attempts to estimate soil loss through the application of the Revised Universal Soil Loss Equation (RUSLE) model in the archaeological sites of Amathus (Cyprus) and Almyriotiki (Greece). The methodology is based on the estimation of soil loss and soil accumulation per unit area, by considering specific parameters such as rainfall factor, topography and land cover management, and using GIS technologies, high-resolution multispectral satellite/UAV images, and high-resolution Digital Elevation Model (DEM). The results showed that the topography and soil type of the more affected region is the main cause of their high vulnerability to soil erosion. The results may contribute to the design of erosion best management measures and wise land use planning in the two study areas.
Sentinel-2 data for assessment of the potential appearance of soil erosion in the Darłowo-Sławno area (Poland): a case study
Slawomir Królewicz, Lidia Żuk, Filip Wałdoch, Adam Młynarczyk, Wlodzimierz Rączkowski (AMU)
The Sentinel-2 satellite platform and L2A-level image products can be used to assess the potential occurrence of soil erosion on an annual scale. This analysis is based on a spatial resolution of 10×10 meters (field of analysis unit). All recorded satellite data were filtered twice for cloud cover criteria in two ways. Firstly, tiled product metadata was used, and secondly, pixel classification products (summed pixels coded/classified as cloud and shadow classes). Based on NDVI, areas of bare soil and low vegetation cover were estimated. These calculations were made for several ranges of the NDVI index. Using a 10×10 DTM map calculated from very high-resolution lidar data, the slope of the terrain was calculated, and then the binary map was classified into two classes (slope less than or equal to 20 and greater than 20). This method identifies pixels/areas are potentially at risk from water or wind erosion (at the time of image registration). Such findings may indicate potential erosion hazards for already identified archaeological sites.
Section 2: Hazard Maps / Other experiences & Future Prospectives
Land use/Land cover Change mapping at different scales
Konstantinos Fokeas (UNITUS)
Preliminary results are presented of the designed methodology for creating land cover thematic and change maps around the Cerveteri study area (ATLAS Project), using optical satellite images of different resolutions. More specifically, the study was based on Landsat 5,7,8 and Sentinel 2 images acquired during the decades 2010 and 2020. Additionally, the inclusion of very high resolution is examined. The methodology, still under development, is exploiting Google Earth Engine and Orfeo ToolBox capabilities while data modelling is based on machine learning algorithms. The results are land cover maps for each year but also the changes between years on a pixel scale. Future research endeavours are also illustrated.
Soil erosion and Landscape quality monitoring with means of Geoinformatics. Examples from Neolithic sites at Thessaly, Greece and rural areas in Crete, Greece.
Dimitris Alexakis (FORTH)
Soil erosion is considered a major environmental problem since it seriously threatens natural resources, cultural heritage, agriculture, and the environment. This paper will present the impacts of a changing climate, land use, soil moisture, hydrology, and vegetation cover on the number of erosion processes in two Neolithic sites at Thessaly, Greece and rural areas on the island of Crete, Greece. Modelling techniques will be used to project the influence of changes in the factors mentioned above on the major determinants of erosion processes at various time and space scales in the near and far future. The above findings on the Spatio-temporal erosion distribution have been used to update the current erosion management plans by developing an integrated low-cost precise erosion system (GUI) with means of Earth Observation. In addition, the general concept of the GEOLAND project will also be presented, highlighting the linking of landscape quality monitoring and soil erosion processes with means of geoinformatics and citizen science.
The use of SAR data in archaeology: future perspectives of the RESEARCH project
Massimo Morigi (ALMA/UNITUS)
The SAR analysis, carried out within the RESEARCH project, is critically analyzed to check the results obtained. In particular, the difficulties in interpreting the data are highlighted, especially when the satellite acquisition are not sufficiently sampled or when specific aspects linked to external variables influencing the results, are not considered. Both Copernicus SAR data released in open data by the European Community, and higher resolution SAR data such as those of the Cosmo SkyMed constellation provided by the Italian Space Agency, were examined and compared. The results express important considerations that can be assumed as recommendations for a future advance of the RESEARCH project or for other similar projects that have faced analogous challenges. The first one is to consider the known strength and limitations of DInSAR and A-DInSAR techniques. The second one regards some methods to insert artificial, hidden and compatible reflectors in historical monuments or archaeological sites, able to support the permanent scatterers that are normally identified by SAR processing software.
Section 3: Archaeological Vulnerability Maps / First Result
Preliminary Ground Penetrating Radar results from the Slawno-Darlowo area
Merope Manataki (S3)
Ground Penetrating Radar (GPR) data analysis is a complex and time-consuming process characterized by trial and error. The main reason is that the recorded signals are highly affected by any change in the soil conductivity, moisture, and terrain surface. The first two have a significant effect on the signal attenuation and travel velocity of the EM waves, while the latter usually increases noise records making it a challenge for both data processing and interpretation. Practically, this means that data collected in the same area but in different periods may have different processing needs. This can be a problem in large-scale GPR surveys, where hundreds of lines are collected, and it can be impractical to devote such a long time to find the proper processing workflow for each GPR line. For this reason, the processing is usually performed in batches, where the same workflow and parameters are applied. However, this can yield poor results and not get the most out of the data. Hence, research to establish a processing workflow that could adapt as much as possible to the GPR data seems a promising direction. The GPR survey in the Slawno-Darlowo area falls under this category. It is a large-scale GPR survey where data were collected in different periods under different weather conditions due to the pandemic. Further, the area has agricultural activities that affect the surface terrain, so high noise levels are expected in the recorded data. Therefore, the processing approach to meet the needs of the RESEARCH project should be two-fold. The first is establishing a workflow to reduce noise and enhance reflections from the subsurface that could be related to antiquities, while the other is to detect and highlight reflections related to soil erosion. Following the abovementioned concept, the work conducted so far focuses on the first approach, i.e., to evaluate and interpret the data with respect to their archaeological context. The data processing, which is still ongoing, was performed in MATLAB, which allows the development of adaptive algorithms and processing routines. Filters and corrections of free distributed toolboxes applicable to GPR (e.g., CREWES, matGPR, and GPRPro) are mainly explored for the case of Cisowo and Dzierżęcin. Here, the preliminary results are presented, discussing the challenges met and suggestions for further improvements.
A Newly Developed Tool for the Post-Processing of GPR Time-Slices in a GIS Environment: from the GPR data to the 2.5D map of buried archaeological structures
Fabiana Battistin, Matteo Serpetti, Stefano De Angeli (UNITUS)
Ground-penetrating radar (GPR) is a precious and reliable research tool broadly used in archaeology because of its capacity to produce three-dimensional data about features preserved underground, such as buildings, infrastructures, and burials, as well as building rubble. GPR data (time-slices) management and exploitation in Geographic Information Systems (GIS) is mostly limited to the visualization and the manual interpretation and mapping of separate single time-slices. This study presents a newly developed plug-in designed to automatically post-process GPR time-slices in a GIS environment, to identify anomalies, and produce a synchronic view of them. This map product, when combined with a DTM, results in a 2D map of subsurface anomalies which shows the absolute height of features above sea level, thus offering a comprehensive view of the three-dimensional configuration of the subsurface features identified. The paper illustrates the pixel-based processing chain of the plug-in and the results of the tests carried out in the case study of the Roman town of Falerii Novi (Italy), on the basis of high-resolution open-access GPR data recently collected by the University of Cambridge and Ghent.
Matteo Serpetti, Fabiana Battistin, Stefano De Angeli (UNITUS)
This presentation is based on the experience of the RESEARCH Project aimed at the development in the GIS environment of a plug-in for the generation of the most superficial layer of a buried archaeological deposit from GPR data and therefore, as illustrated in the previous intervention (Fabiana Battistin), to automatically obtain from the same GPR data and through further development of the plug-in, a 2.5D mapping of the buried structures of an archaeological deposit, i.e. a 2D map of subsurface structures showing the absolute height of features above sea level. In particular, this work, part of my PhD still in progress, aims to develop a new software tool operating in a GIS environment capable of generating the point cloud of buried structures through an automatic post-process of GPR time-slices and then managing and processing this point cloud through the open access software Cloud Compare (to be managed with a specific plug-in for GIS) in order to produce a real 3D of the buried structures. A further step of the work will be to create a BIM (Building Information Model) of buried archaeological structures connected to a Data Base with information on the structures or parts of them, in order to have a useful tool for archaeological interpretation and also for evaluating the vulnerability of buried archaeological structures, in particular in relation to environmental pressures on the soil (land movement, soil erosion, etc.) or other possible pressures of anthropogenic nature. Such models of the buried archaeological structures will also be functional to the development of augmented reality products for possible virtual tours of buried structures.